CAT 72H Pipelayer Operation and Maintenance Manual Page 80
Operation and Maintenance Manual
80
Operation Section (D6T LGP (OEM)) WEBM1000
Machine Operation
From the “Service” menu, use the appropriate arrow
button to highlight the desired menu option. Then,
press the “OK” button in order to display that screen.
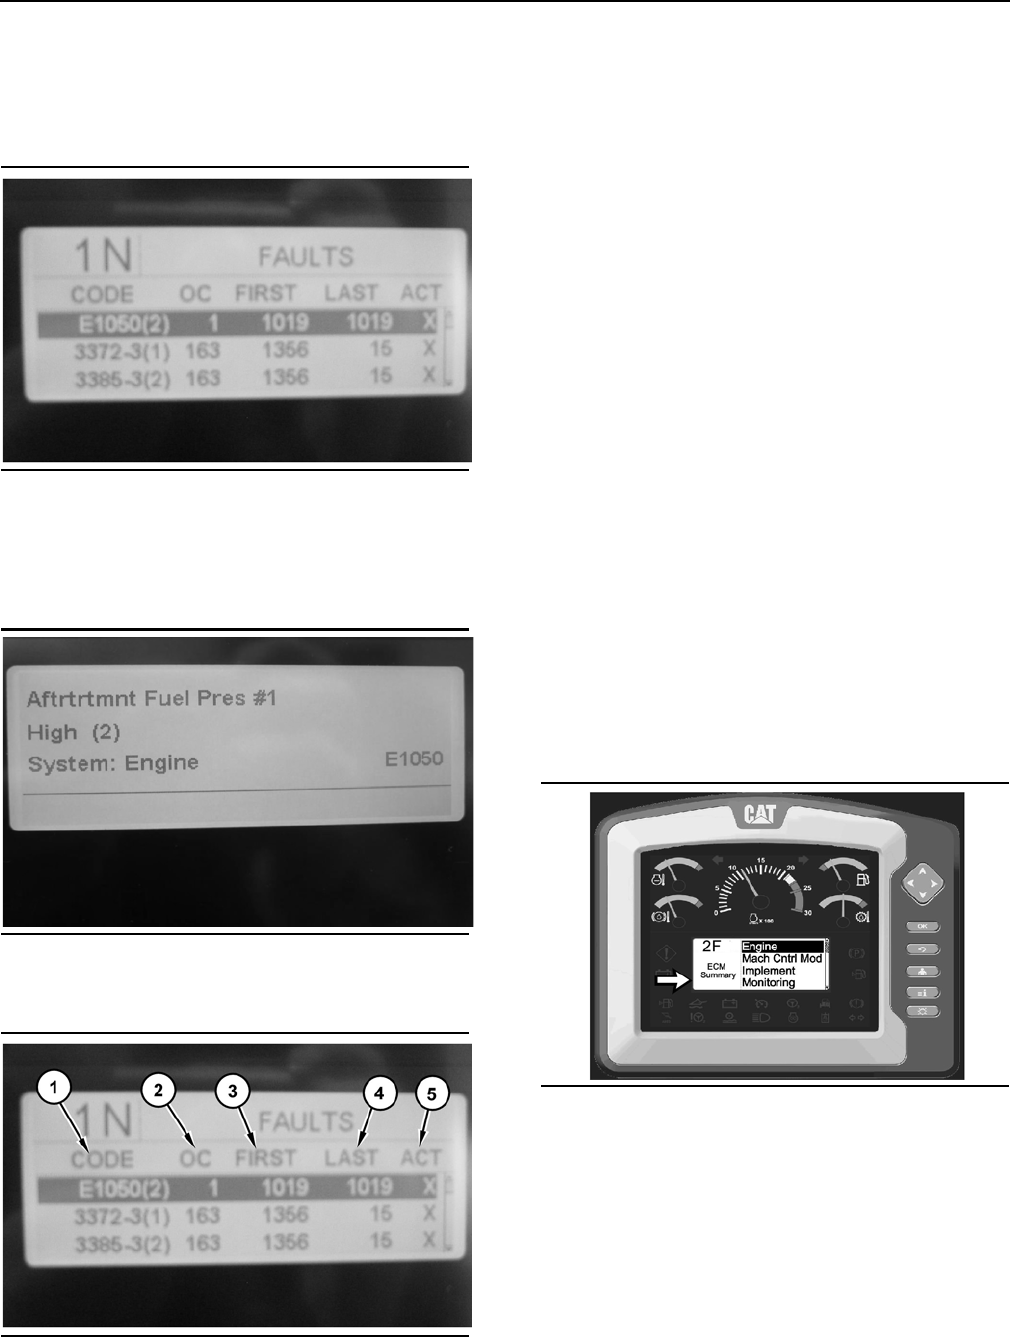
Diagnostic and Event Codes
108
Illustration 108
The “Diagnostics” menu option will show a complete
list of all active events and logged event codes.
Also, the list of active diagnostics and logged
diagnostics is shown.
109
Illustration 109
Diagnostic display
110
Illustration 110
Diagnostic message screen
Each line that is listed contains the following
information about that event or that code.
Fault Code (1) – Component Identifier or Failure
Mode
Identifier (CID/EID)
Occ (2) – Numb
er of occurrences
First (3
) – S
ervice hour of the first occurrence
Last (4
) – S
ervice hour of the last occurrence
Act (5) – “X”
means th
at the event or the code is
curren
tly active.
Logged codes and logged events are cleared with
pass
word protection only.
Active Faults
A second popup screen appears when active faults
or events are reported to the Monitoring System
Display by any ECM. Warning information appears
on the screen and the operator must acknowledge
the warning message by pressing the OK button.
Monitoring System Display will scroll through all the
warning messages that are generated by active
faults or events. The warning messages are not
cleared from system memory by pressing the OK
button. The message may reoccur after a time
according to the severity of the warning information.
ECM Summary
111
Illustration 111
The “ECM Summary” menu option allows the user to
display a list of each ECM with the associated part
numbers on the machine.
Contents Summary of CAT 72H Pipelayer Operation and Maintenance Manual
- Page 1WEBM1000 March 2012 2011 Operation and Maintenance Manual 72H Pipelayer PLR1-Up PLMCAT.COM
- Page 2Important Safety Information Most accidents that involve product operation, maintenance and repair are caused by failure to observe basic safety rules or precautions. An accident can often be avoided by recognizing potentially hazardous situations before an accident occurs. A person must be alert to
- Page 33 Table of Contents Table of Contents Safety Section (D6T LGP (OEM)) Parking................................................................. 101 Safety Messages ................................................... 6 Transportation Information................................... 104 Additional Message
- Page 44 Foreword Foreword Note: Refer to the Caterpillar operation manual for detailed information on the specific operation of the tractor unit Literature Information Safety This manual should be stored in the operator's compartment in the literature holder or seat back The section entitled “Pipelayer
- Page 55 Foreword Maintenance Intervals Machine Capacity Use the service hour meter to determine servicing Additional attachments or modifications may exceed intervals. Calendar intervals shown (daily, weekly, machine design capacity which can adversely affect monthly, etc.) can be used instead of service
- Page 66 Safety Section (D6T LGP (OEM)) WEBM1000 Safety Messages Safety Section (D6T LGP (OEM)) Safety Messages 2 Illustration 2
- Page 77 WEBM1000 Safety Section (D6T LGP (OEM)) Safety Messages 3 Illustration 3 There are several specific safety messages on this Make sure that all of the safety messages are machine. The exact location of the hazards and the legible. Clean the safety messages or replace the description of the hazard
- Page 88 Safety Section (D6T LGP (OEM)) WEBM1000 Safety Messages Replace any safety message that is damaged or Do Not Operate 1 missing. If a safety message is attached to a part of the machine that is replaced, install a safety Safety message (1) is positioned on the upper ledge message on the replaceme
- Page 99 WEBM1000 Safety Section (D6T LGP (OEM)) Safety Messages Seat Belt (2) Do Not Weld on the ROPS (3) Safety message (2) is located on the right console to Safety message (3) is positioned on the vertical the right of the dozer control. support of the outside left ROPS post. m WARNING m WARNING A se
- Page 1010 Safety Section (D6T LGP (OEM)) WEBM1000 Safety Messages Improper Connections for Jump Electrical Shock Hazard (5) Start Cables (4) Safety message (5) is located on the inside of the fuse panel door that is inside the battery box on the Safety message (4) is located on the bottom side of left si
- Page 1111 WEBM1000 Safety Section (D6T LGP (OEM)) Safety Messages Rotating Shaft (6) Do Not Weld on the FOPS (7) This safety message (6) is located on top of the Safety message (7) is positioned on the right side of guard which is covering the drive shaft for the PTO the cab roof. pump. The film is visib
- Page 1212 Safety Section (D6T LGP (OEM)) WEBM1000 Safety Messages Hot Fluid Under Pressure (8) Hydraulic System Accumulator (9) Safety message (8) is located on the bottom side of Safety message (9) is located inside the enclosure the radiator access cover. on the right-hand platform. m WARNING m WARNING
- Page 1313 WEBM1000 Safety Section (D6T LGP (OEM)) Safety Messages High Pressure Recoil Spring (10) High Pressure Cylinder (11) Safety message (9) is located inside the cover for Safety message (11) is located on the access cover the twister resister on both track roller frames. on both track roller frame
- Page 1414 Safety Section (D6T LGP (OEM)) WEBM1000 Additional Messages Compressed Recoil Spring (12) Product Link (13) Safety message (12) is located inside both track Safety message (13) is located on the console to the roller frames. The safety message is located on the right of the operator seat. Refer
- Page 1515 WEBM1000 Safety Section (D6T LGP (OEM)) Additional Messages 4 6 Illustration 6 This message for the air conditioner has the appropriate information for the following services: the air conditioner lubricant, the refrigerant charge and the refrigerant capacity. Also, this safety message instructs
- Page 1616 Safety Section (D6T LGP (OEM)) WEBM1000 Additional Messages 8 Reference: See Operation and Maintenance Manual, “Maintenance Interval Schedule” for all maintenance recommendations. Diesel Fuel Requirements (6) One of the following messages is located next to the fuel filler cap. 10 Illustration
- Page 1717 WEBM1000 Safety Section (D6T LGP (OEM)) General Hazard Information 12 Attach a “Do Not Operate” warning tag or a similar warning tag to the start switch or to the controls. Attach the warning tag before you service the equipment or before you repair the equipment. These warning tags (Special In
- Page 1818 Safety Section (D6T LGP (OEM)) WEBM1000 General Hazard Information Do not smoke when you service an air conditioner. Fluid Penetration Also, do not smoke if refrigerant gas may be present. Inhaling the fumes that are released from a Pressure can be trapped in the hydraulic circuit long flame th
- Page 1919 WEBM1000 Safety Section (D6T LGP (OEM)) Crushing Prevention and Cutting Prevention Inhalation • Use exhaust ventilation on permanent machining jobs. 17 • Wear an approved respirator if there is no other way to control the dust. • Comply with applicable rules and regulations for the work place.
- Page 2020 Safety Section (D6T LGP (OEM)) WEBM1000 Burn Prevention Never jump across the starter solenoid terminals in Coolant order to start the engine. Unexpected machine movement could result. When the engine is at operating temperature, the engine coolant is hot. The coolant is also under Whenever the
- Page 2121 WEBM1000 Safety Section (D6T LGP (OEM)) Fire Prevention and Explosion Prevention Fire Prevention and Explosion Clean all accumulations of flammable materials such as fuel, oil, and debris from the machine. Prevention Do not operate the machine near any flame. 19 Keep shields in place. Exhaust s
- Page 2222 Safety Section (D6T LGP (OEM)) WEBM1000 Fire Prevention and Explosion Prevention Use caution when you are fueling a machine. Do not Daily inspect battery cables that are in areas that are smoke while you are fueling a machine. Do not fuel a visible. Inspect cables, clips, straps, and other mach
- Page 2323 WEBM1000 Safety Section (D6T LGP (OEM)) Fire Prevention and Explosion Prevention • Cracking • End fittings are damaged or leaking. • Discoloration • Outer coverings are chafed or cut. • Cuts on insulation • Wires are exposed. • Other damage • Outer coverings are swelling or ballooning. Make sur
- Page 2424 Safety Section (D6T LGP (OEM)) WEBM1000 Fire Safety Be familiar with the operation of the fire extinguisher. 3. Squeeze the handle and release the Inspect the fire extinguisher and service the fire extinguishing agent. extinguisher regularly. Follow the recommendations on the instruction plate.
- Page 2525 WEBM1000 Safety Section (D6T LGP (OEM)) Electrical Storm Injury Prevention Grease or oil under high pressure coming out of the Move all hydraulic controls to the HOLD position relief valve can penetrate the body causing injury or before starting the engine. Move the direction death. Do not watc
- Page 2626 Safety Section (D6T LGP (OEM)) WEBM1000 Restricted Visibility It may not be possible to provide direct visibility on 23 large machines to all areas around the machine. Appropriate job site organization is required in order to minimize hazards that are caused by restricted visibility. Job site o
- Page 2727 WEBM1000 Safety Section (D6T LGP (OEM)) Operation • additional seat belt Lifting Capacities • Roll over Protective Structure (ROPS) Maintain control of the machine. Do not overload the machine beyond the machine capacity. Ensure that Never use the work tool as a work platform. the correct load
- Page 2828 Safety Section (D6T LGP (OEM)) WEBM1000 Parking Table 1 • Prevent battery discharge that is caused by a When Operating Near High Voltage Power Lines battery short circuit. Normal Voltage (Phase to Phase) Minimum • Prevent battery discharge that is caused by some Clearance of the components. Req
- Page 2929 WEBM1000 Safety Section (D6T LGP (OEM)) Engine Stopping Equipment Lowering with Width of tracks or tires – Narrower tracks or narrower tires further increase the digging into the Engine Stopped ground which causes the machine to be less stable. Before lowering any equipment with the engin
- Page 3030 Safety Section (D6T LGP (OEM)) WEBM1000 Sound Information and Vibration Information “The European Union Physical Agents (Vibration) Directive 2002/ 44/EC” Vibration Data for Track-Type Tractors Information Concerning Hand/Arm Vibration Level When the machine is operated according to the intende
- Page 3131 WEBM1000 Safety Section (D6T LGP (OEM)) Sound Information and Vibration Information Table 2 “ISO Reference Table A - Equivalent vibration levels of whole body vibration emission for earthmoving equipment.” Machine Typical Operating Vibration Levels Scenario Factors Type Activity X axis Y axis Z
- Page 3232 Safety Section (D6T LGP (OEM)) WEBM1000 Operator Station b. Slow down when it is necessary to go over Refer to Operation and Maintenance Manual, rough terrain. SEBU8257, “The European Union Physical Agents (Vibration) Directive 2002/44/EC” for more 8. Minimize vibrations for a long work cycle o
- Page 3333 WEBM1000 Safety Section (D6T LGP (OEM)) Guards Rollover Protective Structure • Demolition applications (ROPS), Falling Object Protective • Rock quarries Structure (FOPS) or Tip Over • Forestry products Protection Structure (TOPS) Additional guards may be required for specific The ROPS/FOPS Stru
- Page 3434 Product Information Section (D6T LGP (OEM)) WEBM1000 General Information Product Information Table 4 D6T Track-Type Tractor Section (D6T LGP (OEM)) LGP Engine Power 200 hp std General Information Engine (Make and Model) Caterpillar C9.3 Engine Displacement 9.3 L (567 in3) Specifications Engine
- Page 3535 WEBM1000 Product Information Section (D6T LGP (OEM)) General Information To obtain the proper lubrication, a maximum slope should not exceed a grade of 100 percent or 45 degrees. Reference: See “Slope Operation” in this manual for more information. Do not use the machine in explosive environmen
- Page 3636 Product Information Section (D6T LGP (OEM)) WEBM1000 Identification Information Identification Information 26 Plate Locations and Film Locations The Product Identification Number (PIN) will be used to identify a powered machine that is designed for an operator to ride. Caterpillar products such
- Page 3737 WEBM1000 Product Information Section (D6T LGP (OEM)) Identification Information 29 • Engine Power for additional engine (kW) (if equipped) • Typical operating weight of machine for European market (kg) • Year of construction • Machine Type For machines that are compliant to “1998/37/EC”, the fo
- Page 3838 Product Information Section (D6T LGP (OEM)) WEBM1000 Identification Information 32 ISO Symbols (Model Usage) The following list contains all of the ISO Symbols that appear in this publication. On or Start – Off or Stop – Electrical Disconnect Switch – Engine On Engine – Start Ether Starting Aid
- Page 3939 WEBM1000 Product Information Section (D6T LGP (OEM)) Identification Information Ripper – Engine ECM – Rear Work Light – Blower Motor – Panel Lights Switch – Panel Test Switch – Flood Lights – Window Washer – Front Work Light – Regeneration Active (indicator) – Horn – Regeneration Disabled (indi
- Page 4040 Product Information Section (D6T LGP (OEM)) WEBM1000 Identification Information Declaration of Conformity Table 5 An EC Declaration of Conformity document was provided with the machine if it was manufactured to comply with specific requirements for the European Union. In order to determine the
- Page 4141 WEBM1000 Product Information Section (D6T LGP (OEM)) Identification Information Emissions Certification Film Note: This information is pertinent in the United States, in Canada and in Europe. Consult your Cat dealer for an Emission Control Warranty Statement. This label is located on the engine
- Page 4242 Operation Section (D6T LGP (OEM)) WEBM1000 Before Operation Operation Section (D6T 35 LGP (OEM)) Before Operation Mounting and Dismounting 34 Illustration 35 Location of the ground level service center After daylight hours end or in periods of darkness, Illustration 34 use the platform access l
- Page 4343 WEBM1000 Operation Section (D6T LGP (OEM)) Before Operation Delayed Lighting Mode • Operation and Maintenance Manual, “Transmission System Oil Level - Check” Enable this function by leaving the Forward ROPS lights in the ON position before turning the machine • Operation and Maintenance Manual,
- Page 4444 Operation Section (D6T LGP (OEM)) WEBM1000 Machine Operation Machine Operation Adjusting the Angle of the Back of the Seat Seat 39 Adjusting the Seat The operator's seat that is provided with this machine is in compliance with the appropriate class of “ISO 7096”. Note: Adjust the seat for a new
- Page 4545 WEBM1000 Operation Section (D6T LGP (OEM)) Machine Operation The bottom seat cushion is in the lower or the flattest Adjustment of the Seat Height (4) – Pull position when the end of the rod is in the bottom of up on height adjustment lever (4) and pull the groove in bracket (3). Pull forward a
- Page 4646 Operation Section (D6T LGP (OEM)) WEBM1000 Machine Operation Seats with Air Suspension and Air Valve Knob Adjusting the Lumbar Support 44 46 Illustration 44 Illustration 46 Adjustment of the Seat Height (6) – Push Adjustment for the Lumbar Support (9) – in on the air valve knob (6) in order to
- Page 4747 WEBM1000 Operation Section (D6T LGP (OEM)) Machine Operation Extension for the Back of the Seat (if Seat Belt equipped) 48 47 Illustration 48 Retractable Seat Belt (11) – When the seat has been adjusted to fit the operator, secure retractable seat belt (11). Storage for the Operation and Mainte
- Page 4848 Operation Section (D6T LGP (OEM)) WEBM1000 Machine Operation Seat Belt 3. Remove the slack from the outer belt loop by pulling on the buckle. Note: This machine was equipped with a seat belt 4. Loosen the other half of the seat belt in the same when the machine was shipped from Caterpillar. At
- Page 4949 WEBM1000 Operation Section (D6T LGP (OEM)) Machine Operation Releasing The Seat Belt Releasing The Seat Belt 54 56 Illustration 54 Illustration 56 Pull up on the release lever. This will release the seat Push the release button on the buckle in order to belt. release the seat belt. The seat bel
- Page 5050 Operation Section (D6T LGP (OEM)) WEBM1000 Machine Operation Operator Controls 57 Illustration 57 (1) Adjustable armrests (2) Parking brake control (3) Differential steering control (4) Transmission direction selector (5) Speed range selector (6) Service brake (7) Decelerator pedal (8) Front wo
- Page 5151 WEBM1000 Operation Section (D6T LGP (OEM)) Machine Operation Adjustable Armrests (1) Parking Brake (2) – Use this switch to engage the parking brake and lock the transmission in the NEUTRAL position. 58 When the parking brake switch is engaged, the parking brake indicator on the dashboard will
- Page 5252 Operation Section (D6T LGP (OEM)) WEBM1000 Machine Operation 61 Transmission Control (4) 62 Illustration 61 When the machine is moving forward, push the steering control forward for a left turn. When the Illustration 62 machine is moving forward, pull the steering control backward for a right t
- Page 5353 WEBM1000 Operation Section (D6T LGP (OEM)) Machine Operation • 3.5 Gauges and Indicators (10) If MVP is OFF, then the following three speeds are available in each direction. Monitoring System Display • 1 63 • 2 • 3 Service Brake Control (6) Push down on the brake pedal in order to apply the ser
- Page 5454 Operation Section (D6T LGP (OEM)) WEBM1000 Machine Operation Speed Range Control Bidirectional Shift Mode (13) Autoshift Mode – The bidirectional shift function MVP Switch (12), If Equipped allows the operator to preset the FORWARD and the REVERSE gear for directional changes and shifts out 64
- Page 5555 WEBM1000 Operation Section (D6T LGP (OEM)) Machine Operation 1F-3.0RConfigurable setting – This active setting Onboard Display can be configured with the “Monitoring System Display” for use in directional shift mode with first 66 speed forward to reduced Eco Reverse . 1F-2R – This setting is
- Page 5656 Operation Section (D6T LGP (OEM)) WEBM1000 Machine Operation 67 Illustration 67 Typical information panels of the “Message Display” 68 Illustration 68 For the complete list of options in the “Settings Menu”, see “Monitoring System” in this manual.
- Page 5757 WEBM1000 Operation Section (D6T LGP (OEM)) Machine Operation Selecting the bidirectional Autoshift function will take the user directly to the interface for the bidirectional First speed forward to second reverse directional Autoshift modes. The interface will have up arrows shift mode (fixed
- Page 5858 Operation Section (D6T LGP (OEM)) WEBM1000 Machine Operation The “Message Display” on the instrument module To activate the auto kickdown mode of operation, with the hand control keypad will scroll through a set push switch (14) that is located on the right side of of gears. The scrolling featu
- Page 5959 WEBM1000 Operation Section (D6T LGP (OEM)) Machine Operation OFF (1) – Inserting the engine start Regeneration Switch (16) switch key and removing the key must only be done from the OFF position. In 76 the OFF position, there is no power to most electrical circuits in the cab. The cab lights, t
- Page 6060 Operation Section (D6T LGP (OEM)) WEBM1000 Machine Operation Regeneration Disabled – The display will When a purge cycle is in progress and the indicate when a regeneration cycle is cancellation of the purge cycle is set to OFF, the disabled. indicator light for the reverse fan function in moni
- Page 6161 WEBM1000 Operation Section (D6T LGP (OEM)) Machine Operation Set the maximum operating speed at a point less Joystick Control (20) than high idle in one of the following manners: 1. Set the engine speed to high idle. Push the Lift Control decelerator pedal until the desired speed is reached. 79
- Page 6262 Operation Section (D6T LGP (OEM)) WEBM1000 Machine Operation Note: Hydraulic lockout control (24) is designed to Additional Operator Controls deactivate the control levers. Disengage the locking tab on the switch to use the hydraulic lockout control. Press the top switch (24) to the lock positi
- Page 6363 WEBM1000 Operation Section (D6T LGP (OEM)) Machine Operation Battery Disconnect Switch (25) Regeneration Switch NOTICE Force Regeneration – Press in the top of Never move the battery disconnect switch to the OFF the switch for 2 seconds in order to begin position while the engine is operating.
- Page 6464 Operation Section (D6T LGP (OEM)) WEBM1000 Machine Operation Modes of Regeneration Indicator will turn off once DPF regeneration has started. Automatic: The engine ECM uses multiple inputs Note: In some situations, the DPF indicator may from the engine and the machine to determine the stay illu
- Page 6565 WEBM1000 Operation Section (D6T LGP (OEM)) Machine Operation Finally, if the engine is still allowed to run through 4. Once the key off regeneration is complete, the multiple forced engine shutdowns, all types of machine will initiate the delayed engine regenerations are locked out. The DPF mus
- Page 6666 Operation Section (D6T LGP (OEM)) WEBM1000 Machine Operation 86 • The action light stays illuminated. • The action alarm sounds once. The monitoring panel is then in the normal operating mode. Action Lamp 87 Illustration 86 Note: At any time during a delayed engine shutdown, the engine start sw
- Page 6767 WEBM1000 Operation Section (D6T LGP (OEM)) Machine Operation Fuel Level (4) – The fuel level gauge indicates the amount of fuel that remains in the fuel tank. A gauge needle in the red zone indicates a low fuel level. (This proceeding indicates a remaining fuel level of approximately 10 percent
- Page 6868 Operation Section (D6T LGP (OEM)) WEBM1000 Machine Operation Status Indicators 88 Illustration 88 Eco Reverse Mode (reverse travel) (6) – Implement Lockout (13) – This indicator This indicator is illuminated when the fuel is illuminated when the implement lockout economy mode is active during r
- Page 6969 WEBM1000 Operation Section (D6T LGP (OEM)) Machine Operation Note: When the machine is moving and the The monitoring system display will show a text operator raises from the seat, the electric power train message for the current highest level active event. systems and the implement operation wi
- Page 7070 Operation Section (D6T LGP (OEM)) WEBM1000 Machine Operation Table 9 WARNING OPERATION Status Indicators (1) “Action Lamp “Action Monitoring Warning Flashes” Alarm System Display Category Sounds ” “Operator Action Required” “Possible Result ”(2) 1 X(3) No immediate action is No machine damage r
- Page 7171 WEBM1000 Operation Section (D6T LGP (OEM)) Machine Operation “Performance” Screens Table 11 “Performance” Screen 2 of 5 90 Description Value Status Units Regen mode Disabled, Inactive Status (control Manual, mode) Automatic Regen mode Active Active Status ( ARD status)(1) Machine XXXXXX.X Hours
- Page 7272 Operation Section (D6T LGP (OEM)) WEBM1000 Machine Operation 92 94 Illustration 92 Illustration 94 Note: The “Main Menu” can be displayed from any The aftertreatment regeneration device system is set screen by pressing Main button (1). to the automatic regeneration mode. Press back button (2) t
- Page 7373 WEBM1000 Operation Section (D6T LGP (OEM)) Machine Operation Emergency Shutdown Override Display Module 96 97 Illustration 96 Illustration 97 This message alerts the operator that a hot engine (A) Gear and Direction shutdown has occurred. The engine key start switch (B) Menu option is in the fo
- Page 7474 Operation Section (D6T LGP (OEM)) WEBM1000 Machine Operation operator profile. 98 Back button (F) – This button is used to return to the previous screen. Navigate to operator menu (G) – This button is used to return to the operator menu. Return to main menu (H) – This button is used to
- Page 7575 WEBM1000 Operation Section (D6T LGP (OEM)) Machine Operation “Select” Profile – This option allows the selection of 1. Turn the key ON. Highlight the “Name” (1) in a saved profile and the associated settings. The order to use the saved preferences. Then, press operator is given this option in o
- Page 7676 Operation Section (D6T LGP (OEM)) WEBM1000 Machine Operation “Settings” Menu 101 Illustration 101 The “Settings” menu allows the user to adjust • Monitoring System Display parameters for the following categories: • Machine operation • Bidirectional shift Operating conditions, preferences of the
- Page 7777 WEBM1000 Operation Section (D6T LGP (OEM)) Machine Operation The “Settings” menu option is entered by selecting Password Entry Screen “Settings” from the main menu. Press the “UP” arrow button or the “DOWN” arrow button until “Settings” is Some of the Settings are password protected. The highli
- Page 7878 Operation Section (D6T LGP (OEM)) WEBM1000 Machine Operation Note: Bidirectional shift can be used to shift to Eco Reverse 3rd reverse automatically. Implement Settings All the parameters in this category relate to the operator preferences for the work tool operational modes. The following para
- Page 7979 WEBM1000 Operation Section (D6T LGP (OEM)) Machine Operation Service Menu 105 Illustration 105 Access the Service Menu 107 106 Illustration 107 Illustration 106 The Service Menu contains the following three categories. The following screen will now be displayed. • Diagnostics • ECM Summary • Li
- Page 8080 Operation Section (D6T LGP (OEM)) WEBM1000 Machine Operation From the “Service” menu, use the appropriate arrow Each line that is listed contains the following button to highlight the desired menu option. Then, information about that event or that code. press the “OK” button in order to display
- Page 8181 WEBM1000 Operation Section (D6T LGP (OEM)) Machine Operation Limp Home Mode (Implement) Steering Limp Home Mode 113 112 Illustration 113 Illustration 112 Menu display The “Implement Limp Home” menu option allows slow incremental movement of the following functions. If a failure occurs in the ma
- Page 8282 Operation Section (D6T LGP (OEM)) WEBM1000 Machine Operation 3. Enter the screen for the limp home mode for • Power Train steering. Make the desired selection. • Steering 116 • Brake Totals Display (Menu) The “Totals” menu option allows the operator or the serviceman to access lists of pertinen
- Page 8383 WEBM1000 Operation Section (D6T LGP (OEM)) Machine Operation 119 Data link connector (B) is located near the power outlets, as shown. This data link connector is for use with the Caterpillar Electronic Technician (ET). Also, this connector is used for the flash programming of software. 122 Illu
- Page 8484 Operation Section (D6T LGP (OEM)) WEBM1000 Machine Operation Table 15 Abbreviation and Term For Monitoring System Abbreviation and Term For Monitoring System Display Display Abbreviation Term Abbreviation Term “kilometers / Imperial kpig act active gallon” autocal automatic calibration kpl “kil
- Page 8585 WEBM1000 Operation Section (D6T LGP (OEM)) Machine Operation Table 16 Abbreviation and Term For Monitoring System Display Abbreviation and Term for Monitoring System Display Abbreviation Term Additional Term sec Second Abbreviation Term secs seconds Aftrmt Aftertreatment seg segment Alt Alterna
- Page 8686 Operation Section (D6T LGP (OEM)) WEBM1000 Machine Operation Abbreviation and Term for Monitoring System Abbreviation and Term for Monitoring System Display Display Additional Term Additional Term Abbreviation Term Abbreviation Term Inhbt Inhibit Rkr Rocker Inj Injector Rng Range Intk Intake Rs
- Page 8787 WEBM1000 Operation Section (D6T LGP (OEM)) Machine Operation Data Broadcasts to be shut off. Refer to Special Instruction, REHS2365 “An Installation Guide for the Product Link PL121SR and for the PL300” and Special Data concerning this machine, the condition of the Instruction, REHS2368 “Instal
- Page 8888 Operation Section (D6T LGP (OEM)) WEBM1000 Machine Operation De-rate – Some machines can have the machine engine de-rated remotely by the owner of the NOTICE machine. The action causes the machine to operate Transmission of information using Product Link is much slower than normal. subject to
- Page 8989 WEBM1000 Operation Section (D6T LGP (OEM)) Machine Operation 124 Illustration 124
- Page 9090 Operation Section (D6T LGP (OEM)) WEBM1000 Machine Operation 125 Illustration 125
- Page 9191 WEBM1000 Operation Section (D6T LGP (OEM)) Machine Operation 126 Illustration 126
- Page 9292 Operation Section (D6T LGP (OEM)) WEBM1000 Machine Operation 127 Illustration 127
- Page 9393 WEBM1000 Operation Section (D6T LGP (OEM)) Machine Operation 128 Illustration 128
- Page 9494 Operation Section (D6T LGP (OEM)) WEBM1000 Machine Operation Backup Alarm 130 Backup Alarm – The alarm sounds when the transmission direction selector is in the REVERSE position. The alarm alerts the people behind the machine that the machine is backing up. The backup alarm is on the rear of th
- Page 9595 WEBM1000 Operation Section (D6T LGP (OEM)) Machine Operation 11. Select an intermediate speed in the following manner: Battery Disconnect Switch 132 a. Set the engine speed to high idle. b. Select the desired engine speed with the decelerator (2). c. Push in on the throttle control switch and h
- Page 9696 Operation Section (D6T LGP (OEM)) WEBM1000 Machine Operation Checking the Battery Disconnect System NOTICE To ensure no damage to the engine occurs, verify that the engine is fully operational before cranking the engine. Do not crank an engine that is not fully operational. Perform the followi
- Page 9797 WEBM1000 Operation Section (D6T LGP (OEM)) Engine Starting Engine Starting 4. Turn key start switch (3) to the ON position. The monitoring system performs an automatic self test. The action alarm sounds and all of the Engine Starting indicator lights come on briefly. The indicator light for the
- Page 9898 Operation Section (D6T LGP (OEM)) WEBM1000 Engine Starting At temperatures below 23C10F), consult your • Maintain desired coolant temperature. Caterpillar dealer. For information on starting the engine in cold weather, refer to the Operation and • Maintain desired operation of engine syst
- Page 9999 WEBM1000 Operation Section (D6T LGP (OEM)) Engine Starting • Allow the engine to warm up for approximately 15 minutes when the temperature is higher than 0C (32F). • Allow the engine to warm up for approximately 30 minutes or more when the temperature is below 0C (32F). • More time may be r
- Page 100100 Operation Section (D6T LGP (OEM)) WEBM1000 Adjustments Adjustments Tracks NOTICE If tracks are too tight or loose, wear of components is accelerated. If they appear too tight or too loose, adjust the track. Follow the procedures in the Maintenance Section for adjustment.
- Page 101101 WEBM1000 Operation Section (D6T LGP (OEM)) Parking Parking 1. While the machine is stopped, run the engine for 5 minutes at low idle. Stopping the Machine 136 NOTICE Park on a level surface. If it is necessary to park on a grade, block the tracks securely. Do not engage the parking brake whil
- Page 102102 Operation Section (D6T LGP (OEM)) WEBM1000 Parking Idling the Engine for Extended 139 Periods If the machine is parked and left running for extended periods, set the engine speed at a slightly higher RPM than low idle. Idling the engine at a higher RPM ensures good engine lubrication. Stopping
- Page 103103 WEBM1000 Operation Section (D6T LGP (OEM)) Parking 7. Inspect the engine compartment for debris. Clean out any debris and paper in order to avoid a fire. 8. Install all the vandalism protection covers and install the locks where equipped. Padlocks are factory installed for the following areas:
- Page 104104 Operation Section (D6T LGP (OEM)) WEBM1000 Transportation Information Transportation Information 8. Install the tie-downs at several locations and block the tracks in the front and in the rear. Shipping the Machine 9. Cover the opening for the engine exhaust. Rotation of the turbocharger witho
- Page 105105 WEBM1000 Operation Section (D6T LGP (OEM)) Transportation Information Note: Do not use handles or steps in order to lift or Consult your Cat dealer for shipping instructions tie down the machine. for your machine. 1. The approximate machine shipping weights are found in the Operation and Maint
- Page 106106 Operation Section (D6T LGP (OEM)) WEBM1000 Towing Information Towing Information These towing instructions are for moving a disabled machine for a short distance at low speed. Move the machine at a speed of 2 km/h (1.2 mph) or less to a Towing the Machine convenient location for repair. These
- Page 107107 WEBM1000 Operation Section (D6T LGP (OEM)) Towing Information All situation requirements cannot be listed. Minimal One or more towing machines must provide towing machine capacity is required on smooth, sufficient control and sufficient braking when you are level surfaces. Maximum towing machi
- Page 108108 Operation Section (D6T LGP (OEM)) WEBM1000 Towing Information 142 143 Illustration 142 Illustration 143 (1) FT1973 Adapter Gp (2) 8T-0855 Pressure Gauge 1. The main pressure hose connects to 9J-6190 (3) 8T-0477 Relief Valve Adapter Union, 04-6683 Nipple, 5P-8018 (4) Handle Adapter Union, 8M-05
- Page 109109 WEBM1000 Operation Section (D6T LGP (OEM)) Towing Information Connection for the Pump 146 144 Illustration 146 (8) Brake control valve (9) Brake valve ports 3. Remove the seat and the floorplate from the operator's station. 4. Remove the pressure test fittings from the top of brake valve ports
- Page 110110 Operation Section (D6T LGP (OEM)) WEBM1000 Towing Information Brake Release Brake Engagement 147 148 Illustration 147 Illustration 148 (5) Bypass valve (5) Bypass valve 1. Turn bypass valve handle (5) to the closed Open bypass valve (5) in order to apply the brakes. position. This will complet
- Page 111111 WEBM1000 Operation Section (D6T LGP (OEM)) Engine Starting (Alternate Methods) Engine Starting (Alternate NOTICE When starting from another machine, make sure that Methods) the machines do not touch. This could prevent damage to engine bearings and electrical circuits. Engine Starting with Ju
- Page 112112 Operation Section (D6T LGP (OEM)) WEBM1000 Engine Starting (Alternate Methods) 7. Check the battery caps for correct placement 13. Start the engine on the machine that is the and for correct tightness. Make these checks on electrical source. Also, you can energize the both machines. Make sure
- Page 113113 WEBM1000 Maintenance Section (D6T LGP (OEM)) Lubricant Viscosities and Refill Capacities Maintenance Section (D6T Machines that are operated continuously should use oils that have the higher oil viscosity in the final LGP (OEM)) drives and in the differentials. The oils that have the higher oi
- Page 114114 Maintenance Section (D6T LGP (OEM)) WEBM1000 Lubricant Viscosities and Refill Capacities Table 17 Lubricant Viscosities for Ambient Temperatures Oil Type and Performance C F Compartment or System Oil Viscosities Requirements Min Max Min Max Cat DEO-ULS Cold Weather SAE 0W-40 40 40 40 104 C
- Page 115115 WEBM1000 Maintenance Section (D6T LGP (OEM)) Lubricant Viscosities and Refill Capacities Table 18 Lubricant Viscosities for Ambient Temperatures Oil Type and Performance C F Compartment or System Oil Viscosities Requirements Min Max Min Max Cat HYDO Advanced 10 SAE 10W 20 40 4 104 Cat TDTO
- Page 116116 Maintenance Section (D6T LGP (OEM)) WEBM1000 Lubricant Viscosities and Refill Capacities Where recommended for use, Cat FDAO SYN Cat FDAO or commercial oil that meets Cat FD-1 are the preferred oil types to maximize gear and bearing life. Do not use Cat FDAO, Cat FDAO SYN, or Cat FD-1 in compa
- Page 117117 WEBM1000 Maintenance Section (D6T LGP (OEM)) Lubricant Viscosities and Refill Capacities Table 21 Lubricant Viscosities for Ambient Temperatures Compartment or Oil Type and C F Application Oil Viscosities System Classification Min Max Min Max SAE 75W-90 30 40 22 104 End Pin Joints for SAE
- Page 118118 Maintenance Section (D6T LGP (OEM)) WEBM1000 Lubricant Viscosities and Refill Capacities Table 22 Recommended Grease C F Compartment or System GreaseType NLGI Grade Min Max Min Max Cat Advanced 3Moly NLGI Grade 2 20 40 4 104 NLGI Grade 2 30 50 22 122 Cat Ultra 5Moly NLGI Grade 1 35 40
- Page 119119 WEBM1000 Maintenance Section (D6T LGP (OEM)) Lubricant Viscosities and Refill Capacities • Lower fuel economy Note: Up to B20 biodiesel blend level is acceptable for use in the engine. • Shorten the time period between oil drain intervals (more frequent oil drain intervals). When biodiesel fue
- Page 120120 Maintenance Section (D6T LGP (OEM)) WEBM1000 Lubricant Viscosities and Refill Capacities Capacities (Refill) S·O·S Information Table 23 S·O·S Services is a highly recommended process for APPROXIMATE REFILL CAPACITIES Cat customers to use in order to minimize owning and operating cost. Customer
- Page 121121 WEBM1000 Maintenance Section (D6T LGP (OEM)) Maintenance Support Maintenance Support Severe Service Application Welding on Machines and An engine which operates outside of normal conditions is operating in a severe service Engines with Electronic application. Controls An engine that operates i
- Page 122122 Maintenance Section (D6T LGP (OEM)) WEBM1000 Maintenance Support • Frequent hot shutdowns (shutting down the engine without the minimum of 2 minutes to 5 minutes of cool down time) • Operation above the engine rated speed • Operation below the peak torque speed • Operating with fuel which does
- Page 123123 WEBM1000 Maintenance Section (D6T LGP (OEM)) Maintenance Interval Schedule Maintenance Interval Schedule Every 50 Service Hours or Weekly Ensure that all safety information, warnings and Cab Filter (Recirculation) - Clean/Inspect/Replace instructions are read and understood before any ........
- Page 124124 Maintenance Section (D6T LGP (OEM)) WEBM1000 Maintenance Interval Schedule Every 2000 Service Hours Fumes Disposal Filter Element - Replace............ 152 Every 2000 Service Hours or 1 Year Cooling System Coolant Sample (Level 2) - Obtain ......................................................
- Page 125125 WEBM1000 Maintenance Section (D6T LGP (OEM)) ARD Spark Plug - Replace ARD Spark Plug - Replace 4. Use a deep well socket and a breaker bar to loosen the spark plug. If necessary, see your Caterpillar dealer for the part number of the Removing the Spark Plug socket. After the spark plug has bee
- Page 126126 Maintenance Section (D6T LGP (OEM)) WEBM1000 Battery - Inspect The backup alarm should start to sound 153 immediately. The backup alarm will continue to sound until the speed range selector is moved to the NEUTRAL position or to the FORWARD position. Battery - Inspect 1. Open the battery acces
- Page 127127 WEBM1000 Maintenance Section (D6T LGP (OEM)) Brakes, Indicators and Gauges - Test 6. Install the new belt around the pulleys. Turn the engine start key to the ON position. The system should act in the following manner: 7. When you release the tension off the belt tensioner, the belt tensioner
- Page 128128 Maintenance Section (D6T LGP (OEM)) WEBM1000 Cab Filter (Fresh Air) - Clean/Inspect/Replace 155 Cab Filter (Fresh Air) - Clean/ Inspect/Replace (If Equipped) 156 Illustration 155 1. Start the engine. 2. Raise all attachments. 3. Depress the service brake pedal. Illustration 156 Top view 4. Rel
- Page 129129 WEBM1000 Maintenance Section (D6T LGP (OEM)) Cab Filter (Recirculation) - Clean/Inspect/Replace Cab Filter (Recirculation) - Cooling System Coolant (ELC) Clean/Inspect/Replace - Change (If Equipped) 157 m WARNING Accidental machine starting can cause injury or death to personnel working on the
- Page 130130 Maintenance Section (D6T LGP (OEM)) WEBM1000 Cooling System Coolant (ELC) - Change Table 25 159 Required Tools Part Tool Part Description Qty Number Mobile Transmission Jack A 1U-7505 1 (Low Lift) 158 Illustration 159 11. Use Tooling (A) and a suitable block to install the front bottom guard.
- Page 131131 WEBM1000 Maintenance Section (D6T LGP (OEM)) Cooling System Coolant Extender (ELC) - Add 17. Stop the engine. For additional information about adding an extender, see Special Publication, SEBU6250 “Caterpillar 161 Machine Fluids Recommendations” or consult your Caterpillar dealer. Extended Lif
- Page 132132 Maintenance Section (D6T LGP (OEM)) WEBM1000 Cooling System Coolant Level - Check Note: Always discard drained fluids according to 163 local regulations. 4. Add 1.20 L (41 oz) of Extender to the cooling system. 5. Start the engine. Run the engine without the filler cap until the thermostat ope
- Page 133133 WEBM1000 Maintenance Section (D6T LGP (OEM)) Cooling System Coolant Sample (Level 1) - Obtain 4. Inspect filler cap (2) and the filler cap seal for debris, for foreign material, or for damage. Clean NOTICE filler cap (2) with a clean cloth. Replace the Care must be taken to ensure that fluids
- Page 134134 Maintenance Section (D6T LGP (OEM)) WEBM1000 Cooling System Coolant Sample (Level 2) - Obtain • Keep the lids on empty sampling bottles until you are ready to collect the sample. Cooling System Coolant Sample (Level 2) - Obtain • Place the sample in the shipping sleeve immediately after obtain
- Page 135135 WEBM1000 Maintenance Section (D6T LGP (OEM)) Cooling System Water Temperature Regulator - Replace Testing the coolant can be done at your Caterpillar dealer. Caterpillar S·O·S Coolant Analysis is the best Cooling System Water way to monitor the condition of your coolant and Temperature Regulat
- Page 136136 Maintenance Section (D6T LGP (OEM)) WEBM1000 Diesel Particulate Filter - Clean/Replace 2. Loosen the hose clamp and remove the hose Note: In order to maintain emissions from the elbow. Disconnect the hose assembly documentation, the DPF that is removed from the from the thermostat housing asse
- Page 137137 WEBM1000 Maintenance Section (D6T LGP (OEM)) Engine Air Filter Primary and/or Secondary Element - Clean/ 1. Open the engine access door on the left side of Secondary Filter the machine. 169 NOTICE Always replace the secondary filter element. Never attempt to reuse the filter by cleaning. The
- Page 138138 Maintenance Section (D6T LGP (OEM)) WEBM1000 Engine Air Precleaner - Clean Engine Air Precleaner - Clean 2. Open the engine access cover that is on the left side of the machine. 171 172 Illustration 172 3. Check the engine oil level gauge while the engine is stopped and the oil is at cold. The
- Page 139139 WEBM1000 Maintenance Section (D6T LGP (OEM)) Engine Oil Sample - Obtain Engine Oil Sample - Obtain 4. Replace the protective cap. 5. Close the engine access door. m WARNING Refer to Operation and Maintenance Manual, Hot oil and components can cause personal “Lubricant Viscosities” for the corr
- Page 140140 Maintenance Section (D6T LGP (OEM)) WEBM1000 Engine Oil and Filter - Change Table 27 Oil Change Interval (1) Operating Conditions Multigrade Oil Type Normal Severe Service Application Cat DEO-ULS 500 hr 250 hr Oil meeting the requirements of the Cat 500 hr 250 hr ECF-3 Specification or the API
- Page 141141 WEBM1000 Maintenance Section (D6T LGP (OEM)) Engine Oil and Filter - Change 1. Remove the bolt in order to remove the 7. Clean the base of the engine oil filter housing. crankcase drain access cover, which is in the Make sure that all of the old filter gasket is crankcase guard. removed. 177 8
- Page 142142 Maintenance Section (D6T LGP (OEM)) WEBM1000 Engine Valve Lash - Check/Adjust 15. Check the oil level. If necessary, add oil. To ensure that the correct amount of oil was added, Equalizer Bar Center Pin - always measure the oil level with the engine oil Lubricate dipstick (5). Refer to Operati
- Page 143143 WEBM1000 Maintenance Section (D6T LGP (OEM)) Equalizer Bar End Pins Oil Level - Check Equalizer Bar End Pins Oil 5. If the oil level is low, apply the gear oil through fitting (3) until the gear oil reaches oil level (4) at Level - Check the top of the hex head on the fitting. Remove any exces
- Page 144144 Maintenance Section (D6T LGP (OEM)) WEBM1000 Final Drive Oil - Change Note: The ether starting aid cylinder must be 5. Clean the drain plug and install the drain plug. installed with the appropriate gasket. The gasket must be clean in order to make a proper seal. 6. Fill the final drive with o
- Page 145145 WEBM1000 Maintenance Section (D6T LGP (OEM)) Final Drive Oil Sample - Obtain Final Drive Oil Sample - Obtain 3. Install oil filler plug (2). 4. Repeat Step 1 to Step 3 in order to sample the oil m WARNING in the other final drive. Hot oil and components can cause personal Reference: Refer to,
- Page 146146 Maintenance Section (D6T LGP (OEM)) WEBM1000 Front Idler Position - Check a. (A) Front Idlers Conventional Design Minimum – 0 mm (0 inch) 190 Maximum – 20 mm (0.8 inch) b. (B) Rear Idlers Minimum – 10 mm (0.4 inch) Maximum – 40 mm (1.6 inch) 4. Repeat Steps 1 through 3 in order to determ
- Page 147147 WEBM1000 Maintenance Section (D6T LGP (OEM)) Fuel Priming Pump - Replace Fuel Priming Pump - Replace NOTICE Do not allow dirt to enter the fuel system. Thoroughly 191 clean the area around a fuel system component that will be disconnected. Fit a suitable cover over disconnected fuel system co
- Page 148148 Maintenance Section (D6T LGP (OEM)) WEBM1000 Fuel System Primary Filter/Water Separator - Drain Fuel System Primary Filter/ 2. Close drain (3). Water Separator - Drain NOTICE The water separator is under suction during normal m WARNING engine operation. Ensure that the drain valve is tightene
- Page 149149 WEBM1000 Maintenance Section (D6T LGP (OEM)) Fuel System Water Separator Element - Replace 194 Instructions for the installation of the filters are printed on the side of each Caterpillar spin-on filter. For non-Caterpillar filters, refer to the installation instructions that are provided by t
- Page 150150 Maintenance Section (D6T LGP (OEM)) WEBM1000 Fuel Tank Cap Filter and Strainer - Replace/Clean 196 8. Wash the filter mounting base in clean, nonflammable solvent. Make sure that all of the old seal is removed. 9. Coat the seal of the new filter element with clean diesel fuel. 10. Install the
- Page 151151 WEBM1000 Maintenance Section (D6T LGP (OEM)) Fuel Tank Water and Sediment - Drain 199 Fuel Tank Water and Sediment - Drain NOTICE Care must be taken to ensure that fluids are contained during performance of inspection, maintenance, testing, adjusting and repair of the product. Be prepared to
- Page 152152 Maintenance Section (D6T LGP (OEM)) WEBM1000 Fumes Disposal Filter Element - Replace Fumes Disposal Filter Element 202 - Replace (Open Crankcase Ventilation (OCV) Filter) 201 Illustration 202 Illustration 201 (1) Cap The filter for the open crankcase ventilation system (2) Housing for the filt
- Page 153153 WEBM1000 Maintenance Section (D6T LGP (OEM)) Fuses and Circuit Breakers - Replace/Reset NOTICE If it is necessary to replace fuses frequently, an electrical problem may exist. Contact your Cat dealer. 203 Illustration 203 On the left side of the machine, open access door (B) to the circuit br
- Page 154154 Maintenance Section (D6T LGP (OEM)) WEBM1000 Fuses and Circuit Breakers - Replace/Reset 205 Illustration 205 Relays (R2) Front flood lights (R3) Cab pressurizer (R4) Forward Flood lights (R5) Access / Egress Light (R6) Fuel priming relay (R7) Spare (R8) Spare (R11) Spare Implement lever (F1) –
- Page 155155 WEBM1000 Maintenance Section (D6T LGP (OEM)) Hydraulic System Oil - Change Spare (F23) – 15 Amp Hydraulic System Oil - Change Spare (F24) – 15 Amp Note: The normal hydraulic oil change interval is Cab pressurizer (F25) – 10 Amp at every 2000 Service Hours or 1 Year. By performing S·O·S
- Page 156156 Maintenance Section (D6T LGP (OEM)) WEBM1000 Hydraulic System Oil - Change • Oils that meet the Cat TO-4 performance 206 requirements that have a minimum zinc additive level of 0.09 percent (900 ppm) Note: Industrial hydraulic oils are not recommended for the hydraulic systems of Caterpillar m
- Page 157157 WEBM1000 Maintenance Section (D6T LGP (OEM)) Hydraulic System Oil Filter (Pilot) - Replace 13. Install the filler cap. 208 14. Start the engine. Operate the engine for a few minutes. 207 Illustration 208 Right side of cab 2. Slowly remove hydraulic tank filler cap (2) in Illustration 207 order
- Page 158158 Maintenance Section (D6T LGP (OEM)) WEBM1000 Hydraulic System Oil Filters - Replace Note: The pilot filter is located in the compartment in front of the hydraulic tank on the right side of the NOTICE machine. Care must be taken to ensure that fluids are contained during performance of inspect
- Page 159159 WEBM1000 Maintenance Section (D6T LGP (OEM)) Hydraulic System Oil Filters - Replace 1. Remove the cover and remove oil filter (4) from Steering Charge Filter the filter housing. Perform the following steps. 216 2. Properly dispose of the filter element. Apply a thin coat of oil to the seal on
- Page 160160 Maintenance Section (D6T LGP (OEM)) WEBM1000 Hydraulic System Oil Level - Check Note: Instructions for the installation of the filter are 219 printed on the side of each Caterpillar spin-on filter. For non-Caterpillar filters, refer to the installation instructions that are provided by the sup
- Page 161161 WEBM1000 Maintenance Section (D6T LGP (OEM)) Lift Cylinder Yoke Bearings - Lubricate If the machine is operated under a high load and/ or under high temperature conditions, sample all Lift Cylinder Yoke Bearings - fluids at the 250 hour interval. Lubricate 1. Open the access cover on the right
- Page 162162 Maintenance Section (D6T LGP (OEM)) WEBM1000 Pivot Shaft Oil Level - Check Nonferrous metals can indicate wear on the Reference: See Operation and Maintenance aluminum parts of the engine such as main Manual, “Lubricant Viscosities” in this manual for the bearings, rod bearings, or turbocharge
- Page 163163 WEBM1000 Maintenance Section (D6T LGP (OEM)) Recoil Spring Compartment Oil Level - Check 225 1. Remove all of the debris around the cover plate on the top of the track roller frame. 2. Remove the cover plate for the oil filler. Observe the level of the oil. 227 Illustration 225 1. Open the rad
- Page 164164 Maintenance Section (D6T LGP (OEM)) WEBM1000 Refrigerant Dryer - Replace Refrigerant Dryer - Replace 228 (If Equipped) m WARNING Personal injury can result from contact with refrigerant. Contact with refrigerant can cause frost bite. Keep face and hands away to help prevent injury. Protective
- Page 165165 WEBM1000 Maintenance Section (D6T LGP (OEM)) Rollover Protective Structure (ROPS) - Inspect Rollover Protective Structure 231 (ROPS) - Inspect 230 Illustration 231 Typical example Inspect buckle (1) for wear or for damage. If the buckle is worn or damaged, replace the seat belt. Inspect seat b
- Page 166166 Maintenance Section (D6T LGP (OEM)) WEBM1000 Torque Converter Scavenge Screen - Clean 233 232 Illustration 232 Typical Example Illustration 233 (1) Date of installation (retractor) Rear view (2) Date of installation (buckle) (3) Year of manufacture (tag) (fully extended Web) (4) Year of manufa
- Page 167167 WEBM1000 Maintenance Section (D6T LGP (OEM)) Track - Check/Adjust Track - Check/Adjust 236 235 Illustration 236 The machine is equipped with a carrier roller. Calculate the average of dimension (A) and dimension (B). The correct average value is 55 10 mm (2.2 0.4 inch). Loose Track Adjustm
- Page 168168 Maintenance Section (D6T LGP (OEM)) WEBM1000 Track Pins - Inspect 238 Track Pins - Inspect m WARNING Fingers can be burned from hot pins and bushings. The pins and bushings in a dry joint can become very hot. It is possible to burn the fingers if there is more than brief contact with these com
- Page 169169 WEBM1000 Maintenance Section (D6T LGP (OEM)) Track Roller Frame Guides - Inspect 1. Raise the front of the machine with the hydraulics 242 of the dozer. Place a 100 mm (4 inch) block under the outside edge of a track grouser. Place the block near the track idler. Lower the machine onto the blo
- Page 170170 Maintenance Section (D6T LGP (OEM)) WEBM1000 Transmission Breather - Clean/Replace Transmission Breather - Clean/ Replace Replace Replace the transmission breather if the breather is no longer capable of cleaning. Clean 246 244 Illustration 246 1. The transmission breather is located on the bu
- Page 171171 WEBM1000 Maintenance Section (D6T LGP (OEM)) Transmission Oil - Change 4. Wash the screen and the magnet assembly in a 248 clean, nonflammable solvent. 5. Inspect the seal. If the seal is damaged, install a new seal. 6. Install the screen and the magnet assembly. 7. Install the cover on the sc
- Page 172172 Maintenance Section (D6T LGP (OEM)) WEBM1000 Transmission Oil Filter - Replace 3. Fill the bevel gear case with oil. See Topic “Refill If the transmission oil filter indicator in the monitoring Capacities” in this manual. panel comes on before 1000 hours, the filter should be changed. 250 The
- Page 173173 WEBM1000 Maintenance Section (D6T LGP (OEM)) Transmission Oil Level - Check 252 254 Illustration 252 Illustration 254 (2) Warm Oil Full marks (3) Cold Oil (5) Warm oil (6) Cold oil 2. Remove the transmission oil level gauge (1). Maintain the oil level within the marks for the 8. Maintain the o
- Page 174174 Maintenance Section (D6T LGP (OEM)) WEBM1000 Transmission System Oil Sample - Obtain 255 Obtain the sample of the transmission oil as close as possible to the recommended sampling interval. The recommended sampling interval is every 500 service hours. In order to receive the full effect of S·O
- Page 175175 WEBM1000 Maintenance Section (D6T LGP (OEM)) Window Wipers - Inspect/Replace 257 Reference: See “Mounting and Dismounting” in this manual for additional information. 3. Replace any wiper blades that are damaged or worn. Replace any wiper blades that streak the window. Windows - Clean Use comme
- Page 176176 Maintenance Section (D6T LGP (OEM)) WEBM1000 Windows - Clean Clean the outside of the rear window from the ground or with the use of a man lift, unless appropriate handholds are available. 261 Illustration 261
- Page 177177 WEBM1000 Warranty Section (D6T LGP (OEM)) Warranty Information Warranty Section (D6T LGP (OEM)) Warranty Information Emissions Warranty Information Caterpillar Inc. (Caterpillar) warrants to the ultimate purchaser and each subsequent purchaser that: 1. New non-road diesel engines and stationar
- Page 178178 Reference Information Section (D6T LGP (OEM)) WEBM1000 Reference Materials Reference Information • Special Instruction, REHS1110 “Installation and Removal of SystemOne Track” Section (D6T LGP (OEM)) • Special Instruction, REHS2403 “Installation and Removal of SystemOne Track with the Multi-Pit
- Page 179179 WEBM1000 Reference Information Section (D6T LGP (OEM)) Reference Materials SAE J754,“Nomenclature” This reference can normally be found in the SAE handbook. Decommissioning and Disposal SAE J183,“Classification” This reference can normally be found in the SAE handbook. When the product is remo
- Page 180180 Safety Section (Pipelayer Attachment Kit) WEBM1000 Safety Messages - 72H Pipelayer Safety Section (Pipelayer Safety Messages - 72H Attachment Kit) Pipelayer Certain conditions and precautions are peculiar to NOTICE pipelaying operations. The following represents the Other safety precautions r
- Page 181181 WEBM1000 Safety Section (Pipelayer Attachment Kit) Safety Messages - 72H Pipelayer 263 Illustration 263 Safety Messages 72H Pipelayer There are several specific safety messages on this machine. The exact location of the hazards and the description of the hazards are reviewed in this section. P
- Page 182182 Safety Section (Pipelayer Attachment Kit) WEBM1000 Safety Messages - 72H Pipelayer Make sure that all of the safety messages are Do Not Operate 1 legible. Clean the safety messages or replace the safety messages if you cannot read the words. Safety message (1) is located outside of the left Re
- Page 183183 WEBM1000 Safety Section (Pipelayer Attachment Kit) Safety Messages - 72H Pipelayer Electrical Power Lines 2 Hydraulic Accumulator 3 Safety message (2) is located on the right side of the Safety message (3) is attached to the hydraulic console, on the guarding to the front of the pipelayer accu
- Page 184184 Safety Section (Pipelayer Attachment Kit) WEBM1000 Safety Messages - 72H Pipelayer Hydraulic Accumulator 4 Free Fall Active - Do Not Operate 5 Safety message (4) is located on the lower right side Safety message (5) is located on the right side, on of the console, below the pipelayer controls.
- Page 185185 WEBM1000 Safety Section (Pipelayer Attachment Kit) Safety Messages - 72H Pipelayer Boom Stop Operation and Tipover Hazard 7 Adjustment - Do Not Operate 6 Safety message (7) is located to the of the console, on the upper winch guarding. Safety message (6) is located on the left side of the cros
- Page 186186 Safety Section (Pipelayer Attachment Kit) WEBM1000 Safety Messages - 72H Pipelayer Counterweight Crushing Hazard 8 Counterweight Crushing Hazard 9 Safety message (8) is located on the front and rear Safety message (9) is located on the front and rear sides of the Counterweight arm. sides of th
- Page 187187 WEBM1000 Safety Section (Pipelayer Attachment Kit) Before Operation Counterweight Lock Lever Thrown Visibility Information or Flying Objects - Full Body Before starting the machine, the operator shall Exposure 10 perform a walk-around inspection in order to ensure that there are no hazards aro
- Page 188188 Safety Section (Pipelayer Attachment Kit) WEBM1000 Visibility Information 264 Illustration 264 Operator Field of View as per ISO 5006:2006 The operator is required to survey his/her field of The left-hand side view mirrors shall be adjusted so vision when operating the machine. the operator is
- Page 189189 WEBM1000 Safety Section (Pipelayer Attachment Kit) Operation • Operator training Whenever possible, operate the machine up the slopes and down the slopes. Avoid operating the • Warning symbols or warning signs on machines or machine across the slope, when possible. on vehicles Keep the machine
- Page 190190 Safety Section (Pipelayer Attachment Kit) WEBM1000 Parking When the load capacity is exceeded, refer to While In Transit Near High Voltage Power Lines “American National Standards A.N.S.I. B3014”. Normal Voltage (Phase to Phase) Minimum Also, follow the procedures that are listed below: Cleara
- Page 191191 WEBM1000 Safety Section (Pipelayer Attachment Kit) Equipment Lowering with Engine Stopped Speed of travel – At higher speeds, forces of inertia Note: Safe operation on steep slopes may require tend to make the machine less stable. special machine maintenance. Excellent skill of the operator
- Page 192192 Safety Section (Pipelayer Attachment Kit) WEBM1000 Guards “The European Union Physical Agents (Vibration) Directive 2002/ 44/EC” Refer to the tractor operation and maintenance manual "The European Union Physical Agents (Vibration) Directive 2002/44/EC " for complete information, noting that th
- Page 193193 WEBM1000 Product Information Section (Pipelayer Attachment Kit) General Information Product Information Section (Pipelayer Attachment Kit) General Information Components 265
- Page 194194 Product Information Section (Pipelayer Attachment Kit) WEBM1000 General Information Illustration 265 Component Identification Specifications 266 Illustration 266 Standard shipping specifications, height and width
- Page 195195 WEBM1000 Product Information Section (Pipelayer Attachment Kit) General Information Table 29 Lifting Capacities 72H Pipelayer Approximate operating weight of the standard 29 207 kg (64,390 lb)) m WARNING machine(1) The machine may tip and personal injury may Approximate shipping 28 780 kg (63,
- Page 196196 Product Information Section (Pipelayer Attachment Kit) WEBM1000 General Information 268 Illustration 268 Lift capacity chart Note: Do not exceed the lifting capacity that is shown in the chart in illustration above. The lift capacity chart is located on the right hand winch-guarding to the fro
- Page 197197 WEBM1000 Operation Section (Pipelayer Attachment Kit) Before Operation Operation Section (Pipelayer Attachment Kit) Before Operation Mounting and Dismounting 269 Illustration 269 Mounting and dismounting machine Use steps and handholds whenever you mount the machine. Use steps and handholds wh
- Page 198198 Operation Section (Pipelayer Attachment Kit) WEBM1000 Before Operation 270 Illustration 270 Daily inspection walk around For maximum service life of the machine, perform a Note: Refer to the tractor operation manual for daily walk-around inspection. detailed information on the specific daily i
- Page 199199 WEBM1000 Operation Section (Pipelayer Attachment Kit) Before Operation • "Counterweight Hinge Pins - Lubricate" • "Fairlead Sheave - Lubricate" • "Hook and Wire Cable Inspect" • "Hydraulic System Oil Level - Check" • "Sheave Block Bearings - Lubricate" • "Boom Stop Valve - Check operation" Tra
- Page 200200 Operation Section (Pipelayer Attachment Kit) WEBM1000 Before Operation Pipelayer Operation 271 Illustration 271 Controls for pipelayer Speed/Lockout Control Lever (1) LOCKED MODE—WINCH AND CONTROLS LOCKED – To prevent accidental actuation of the hook and boom winch controls while The speed/loc
- Page 201201 WEBM1000 Operation Section (Pipelayer Attachment Kit) Before Operation LOW SPEED MODE—WINCH (Emergency Lower) Free Fall – l- Move the CONTROLS UNLOCKED – Pull the speed/lockout hook control lever to this position to lower the load control lever back for the hook winch low speed fast in an emer
- Page 202202 Operation Section (Pipelayer Attachment Kit) WEBM1000 Before Operation Accumulator - Relieving Charge Counterweight Control (5) To relieve the accumulator charge, with no load on the hook and the engine stopped, move the hook NOTICE control lever from "HOLD" to "RAISE" 10 times. In order to p
- Page 203203 WEBM1000 Operation Section (Pipelayer Attachment Kit) Before Operation Throttle control switch & Operator Heater switch (7) 272 Illustration 272 Control Switches Throttle Control Switch, Refer to tractor's operation 273 and maintenance manual for correct operation Hydraulic lockout switch—Remo
- Page 204204 Operation Section (Pipelayer Attachment Kit) WEBM1000 Before Operation 274 Locked - Extend counterweight cylinders to maximum length Engage the lock lever (1). Slowly retract the counterweight slightly until there is pressure on the lock lever (1). Do not continue to retract the counterweight
- Page 205205 WEBM1000 Operation Section (Pipelayer Attachment Kit) Before Operation Equipment Lowering with Engine Stopped 276 Illustration 276 Controls for Equipment lowering with engine stopped • Unlock the Speed/Lockout Control Lock (2) and NOTICE move the Speed/Lockout Control Lever (1) to LOW Before
- Page 206206 Operation Section (Pipelayer Attachment Kit) WEBM1000 Before Operation • The accumulator will provide pilot pressure that 8. Install the tie-downs at several locations and will allow the hook to be immediately lowered fast chock the tracks in the front and in the rear. under the weight of the
- Page 207207 WEBM1000 Operation Section (Pipelayer Attachment Kit) Before Operation 279 Illustration 279 Removal of boom, steps 1, 2 2. Remove cotter pin, the retainer, and pin (1). Lower the load block and the hook block to the ground. The approximate weight of the load block is 88 kg (194 lb). The approx
- Page 208208 Operation Section (Pipelayer Attachment Kit) WEBM1000 Before Operation 280 Illustration 280 Fastening of Load Blocks for Transport 4. Remove pin (6) and insert stowing-link (4) into 281 bumper pocket (7) and reinstall pin (6). 5. Place hook load line over guide (5). 6. Slowly draw in the exces
- Page 209209 WEBM1000 Operation Section (Pipelayer Attachment Kit) Before Operation 282 Illustration 282 Location of Luff Block stowing point and stowing pin (9) 15. Draw in the line for the boom and fasten the luff block to the machine at the luff block stowing point on the track frame for shipping using
- Page 210210 Maintenance and Lubrication Section (Pipelayer Attachment Kit) WEBM1000 Lubricant Viscosities Maintenance and Lubrication Section (Pipelayer Attachment Kit) Lubricant Viscosities General • Follow tractor manufacture's maintenance and lubrication instructions for tractor service as required. •
- Page 211211 WEBM1000 Maintenance and Lubrication Section (Pipelayer Attachment Kit) Lubricant Viscosities for Ambient Temperatures Table 31 Lubricant Viscosities for Ambient Temperatures Compartment or System Oil Type and Classification Oil Viscosities °C °F Min Max Min Max Caterpillar HYDO SAE 0W20 Cater
- Page 212212 Maintenance and Lubrication Section (Pipelayer Attachment Kit) WEBM1000 Maintenance Interval Schedule (MIS) Maintenance Interval Schedule Every 50 Service Hours or Weekly (MIS) Thoroughly check Boom Stop system operation and adjustment, lubricate boom stop valve roller and ac- Ensure that all
- Page 213213 WEBM1000 Maintenance and Lubrication Section (Pipelayer Attachment Kit) 283 Illustration 283 Accumulator located behind access panels to right of operator seat.
- Page 214214 Maintenance and Lubrication Section (Pipelayer Attachment Kit) WEBM1000 Boom Stop Valve Operation and Adjustment Table 33 • Raise the boom vertical so that it is JUST in contact with the tower; the boom kick-out rod is Ambient air temperature Accumulator precharge fully retracted into the towe
- Page 215215 WEBM1000 Maintenance and Lubrication Section (Pipelayer Attachment Kit) 285 NOTICE Make sure that the construction of the wire rope is 6x25 IWRC XIPS (Independent Wire Rope Core, eXtra Improved Plow Steel) USA MADE. Also, the established grade of the wire rope is the improved plow bolt (steel
- Page 216216 Maintenance and Lubrication Section (Pipelayer Attachment Kit) WEBM1000 Boom Line – Install 286 Illustration 286 nstalling boom line (A) Wire rope from the winch (B) Detail B 6. Install the wire rope from the winch to sheave (8) in the upper sheave block. Install the wire rope over sheave (8)
- Page 217217 WEBM1000 Maintenance and Lubrication Section (Pipelayer Attachment Kit) 287 Illustration 287 Inserting wire rope into cable anchor 9. Insert the wire rope into the pocket and around 288 the wedge (11). Allow an additional length of cable to form a tail end (six inch minimum). Use a mallet to t
- Page 218218 Maintenance and Lubrication Section (Pipelayer Attachment Kit) WEBM1000 Counterweight Cylinder Bearings – Lubricate Counterweight Cylinder Counterweight Hinge Pins - Bearings – Lubricate Lubricate m WARNING 289 Use a stable work platform placed in a secure location when lubricating the counter
- Page 219219 WEBM1000 Maintenance and Lubrication Section (Pipelayer Attachment Kit) 292 Hook and Wire Cable – Inspect Inspect the Hook Inspect the hook frequently. The inspections should include observation of the hook during operation of the hook. A designated person determines if the conditions that are
- Page 220220 Maintenance and Lubrication Section (Pipelayer Attachment Kit) WEBM1000 Hook Load Line – Install • Inspect the cable for a reduction in the diameter of Note: For additional information on the proper the cable below the nominal diameter. A loss of maintenance and on inspection of the cable, ref
- Page 221221 WEBM1000 Maintenance and Lubrication Section (Pipelayer Attachment Kit) 294 295 Illustration 295 Installing hook load line (A) Wire rope from the winch. 3. Install the hook load line from the winch drum onto the sheave blocks in the following manner: • Install the cable for the hook winch from
- Page 222222 Maintenance and Lubrication Section (Pipelayer Attachment Kit) WEBM1000 Hydraulic System Oil - Change 4. Install the pipe nipple into the drain plug m WARNING opening. At operating temperature, the hydraulic tank is 5. Rotate the pipe nipple clockwise in order to open hot and under pressure. H
- Page 223223 WEBM1000 Maintenance and Lubrication Section (Pipelayer Attachment Kit) 12. See the Operation and Maintenance Manual, “Capacities (Refill) in order to determine the amount of hydraulic oil that is needed to fill the hydraulic oil tank. Fill the hydraulic oil tank. 13. Inspect the filler cap ga
- Page 224224 Maintenance and Lubrication Section (Pipelayer Attachment Kit) WEBM1000 Hydraulic System Oil Filter - Replace 298 Illustration 298 Filter locations 299 300 Illustration 299 Filter locations Illustration 300 Filter location (1) Transmission oil filter (2) Hydraulic system filter (3) Hydraulic T
- Page 225225 WEBM1000 Maintenance and Lubrication Section (Pipelayer Attachment Kit) 3. Remove filter (1, 2, and 4). 3. If the hydraulic system requires additional hydraulic oil, remove filler cap (2) and add oil. Note: Remove case drain hydraulic filter (1). Clean filler cap (2) and install filler cap (2)
- Page 226226 Maintenance and Lubrication Section (Pipelayer Attachment Kit) WEBM1000 Sheave Block Bearing – Lubricate Sheave Block Bearing – Tractor Maintenance Lubricate Refer to the tractor’s operation and maintenance manual for the specific procedures regarding 303 complete Tractor Maintenance. Illustra
- Page 227227 Index Section Circuit Breakers .................................................. 155 Commercial Oils ................................................. 155 IndexA Components ....................................................... 193 Compressed Recoil Spring ................................... 1
- Page 228228 Index Section Emissions Certification Film .................................. 41 Foreward ................................................................. 4 Emissions Warranty Information ......................... 177 Free Fall Active - Do Not Operate ...................... 184 Engine Air Fil
- Page 229229 Index Section Idling ..................................................................... 98 Monitoring System ................................................ 66 Idling the Engine for Extended Periods ............... 102 Monitoring System Display ............................. 53, 70 Implement
- Page 230230 Index Section Reporting a Problem ............................................. 83 Stopping the Machine ......................................... 101 Restricted Visibility ................................................ 26 Storage for the Operation and Maintenance Restrictions to Application
- Page 231231 Index Section Window Washer Reservoir - Fill .......................... 174 Window Wipers - Inspect/Replace ...................... 175 Windows - Clean ................................................. 175 Wiring .................................................................... 22
- Page 232© 2012 Pipeline Machinery International All Rights Reserved Printed in USA